However, there are often times that you’ll need a tool more specific to your own workflow that Android Studio doesn’t provide, and that’s exactly where Flipper’s extensibility really shines. As an example, I’d like to go through building a custom plugin for Flipper, similar to one that I’ve used on my own projects, that demonstrates how easy it is to get started building these tools.
As most apps grow, there becomes a need to measure app usage and engagement to better understand user behavior. In order to measure that, we often turn to analytics libraries (like Firebase Analytics) to handle this in-app behavior reporting. However, when implementing these client events, it’s often helpful to have a quick feedback loop to ensure that the event and associated payload are correct, without having to check an analytics dashboard (which can often take some time to refresh).
Luckily, most analytics libraries (including Firebase) have different solutions for this problem. In the Firebase Analytics library, the recommended debugging method is to set a property with ADB to log all the events to logcat. This does provide much faster feedback than checking a dashboard, but it’s not the most user friendly – developers need to set the property at the command line, and need to be monitoring logcat for all of the events (and also doesn’t offer much of a search/filter function).
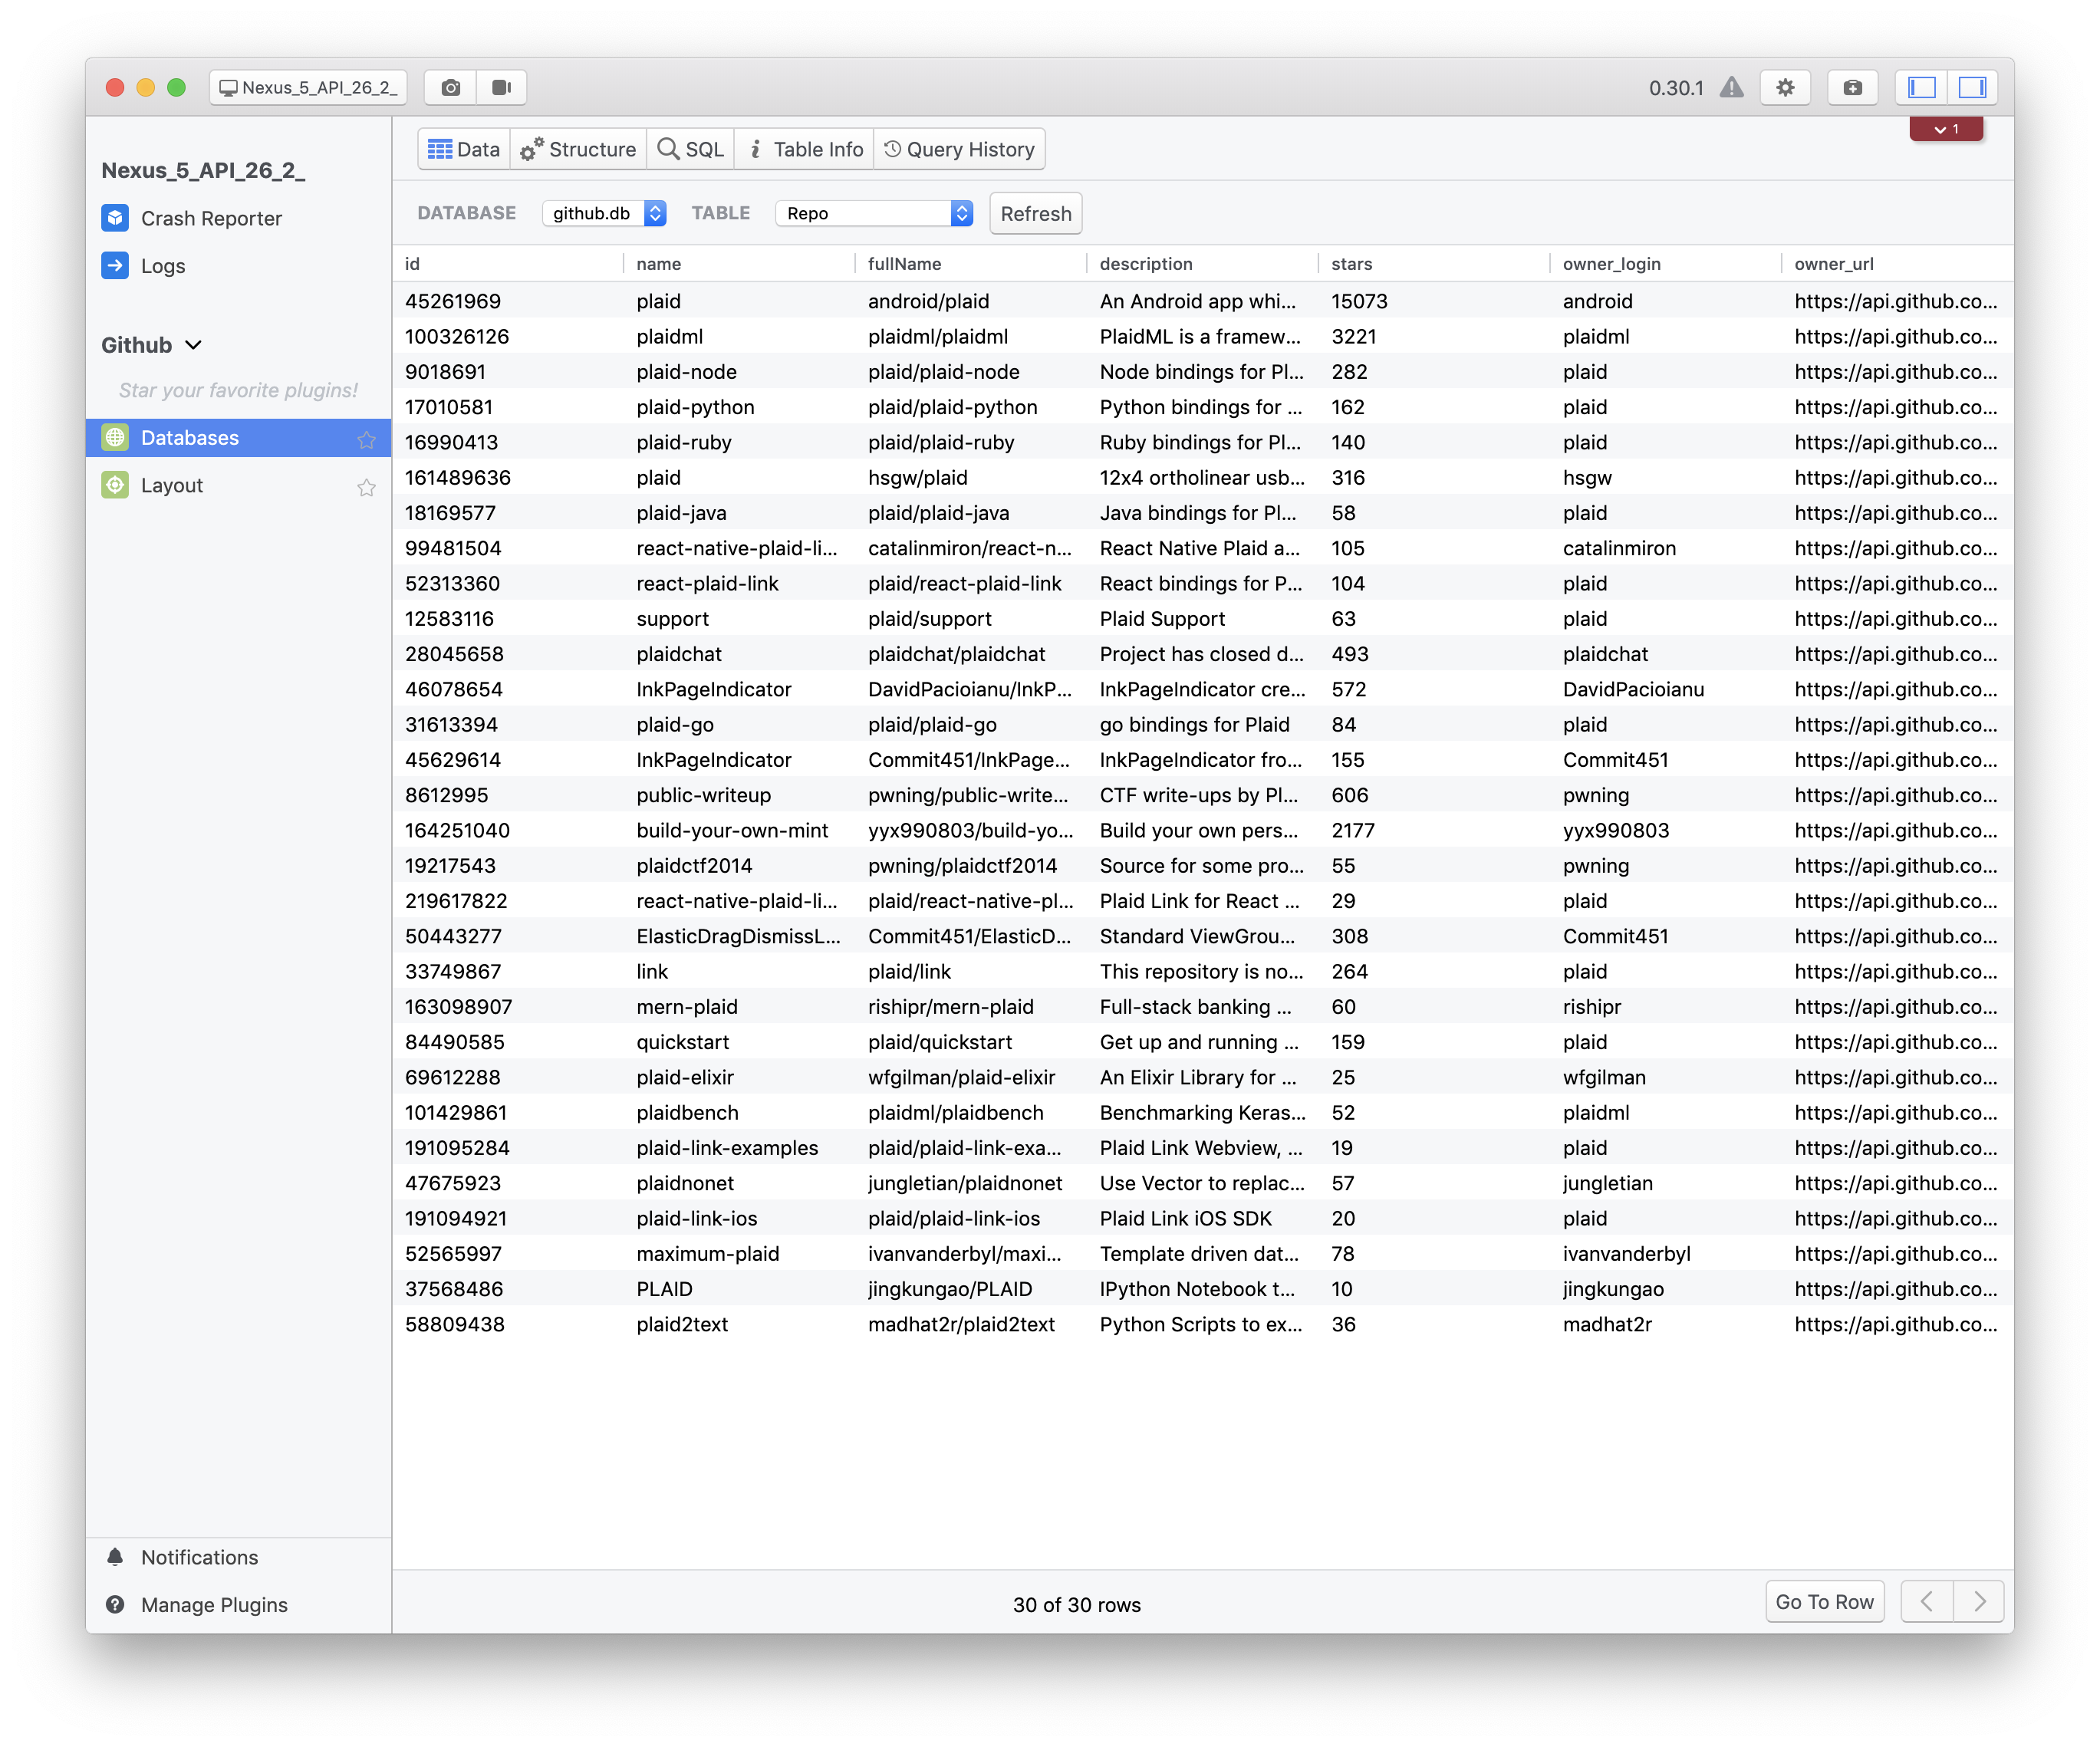
Rather than sticking to plain text in logcat, we can build a custom Flipper plugin that will display our analytics events in a filterable table. Most Flipper plugins are comprised of two parts – a client library that runs as part of your Android app, and a desktop plugin that runs inside Flipper for processing and displaying the data sent by the client.
All of the code for this example can be found in this example Github Repository.
On the Android side, you’ll need to add the Flipper SDK if you haven’t already. If you have Flipper set up already, you can skip to the next section. If not, here’s a quick run-down:
Add the Gradle dependencies:
1 2 3 4 5 6 |
|
Configure your Application class:
1 2 3 4 5 6 7 8 9 10 11 12 |
|
And now it’s time to build the plugin! Create a class to hold your plugin logic (For this example, I will call mine AnalyticsPlugin
). For the purposes of this sample, it’ll be a singleton object
for reasons that we’ll see later.
We’ll subclass the BufferingFlipperPlugin
class, rather than FlipperPlugin
, because the bufffering version will keep our events in a buffer until the connection is made with the desktop client (so that we don’t lose any events).
We need to override getId()
, which is how Flipper will correlate our client plugin with the matching desktop plugin, and runInBackground()
in order to tell Flipper to keep communicating with the desktop client, even if our plugin isn’t the currently in the foreground.
Lastly, we’re going to create a reportEvent
method, which will send whatever data we want to the server. In this example, we’ll send a unique identifier for the event, the event name, and the timestamp that the event occured at. Note: FlipperObject
can even be constructed by using JSON text or a JSONObject
!
Here’s what our plugin might look like:
1 2 3 4 5 6 7 8 9 10 11 12 13 14 15 16 17 18 19 |
|
After we create our plugin, we’ll need to go back to our Application class to install our plugin, just like we would with the pre-loaded ones:
1 2 3 4 |
|
The last thing we need to do is actually call our plugin somewhere. The implementation of this part will depend a lot on the particular implementation of your own app, but for this example we’ll have an Analytics
class that conditionally logs our events to Flipper in debug builds, and would do some normal production logic otherwise.
1 2 3 4 5 6 7 8 9 10 11 12 |
|
Once that’s all done, the client work is complete!
In order to build the desktop-side plugin, we’ll need to set up our environment. We’ll need something called npx
, which is a tool to execute Javascript packages. npx
can be installed from Homebrew with brew install npx
.
Once npx
is installed, run the following command in the directory that you’d like to create your plugin in:
1
|
|
This command will kick off a little bit of a “new plugin wizard”, asking a few questions about the plugin we’ll be creating:
client
. (Flipper also supports device
plugins that don’t need any particular app to be running. For example, Logcat provides logs for the entire device, rather than needing any individual app).After that, you should be able to cd
into the newly created module directory and run yarn watch
to have the plugin continuously be compiled when you make changes.
If you’re familiar with JavaScript and React (I’m not especially), creating the desktop side of the plugin might be easy. However, if you’re not experienced with these tools, Flipper includes some very convenient helpers for building a simple table UI. In this example, that’s exactly what we’ll be doing – let’s get started!
The init command we ran earlier auto-generated some files, one of which is index.tsx
inside the src
directory. Majority of the changes we’ll need to make will be in this file.
For our table, the first thing we’ll need to define is the fields that will be shown in each row:
1 2 3 4 5 |
|
The next thing we need to do is create something called a DataTableColumn
, which tells Flipper how to display our data. Each object defined in this section will map to the columns in our table – we can optionally provide a title
to provide a more meaningful label at the top of the table and a width
in either pixels, percent or nothing (which will distribute the space evenly).
1 2 3 4 5 6 7 8 9 10 |
|
Lastly, we will use the Flipper createTablePlugin
function to glue this all together:
1 2 3 4 5 6 |
|
If a simple table is not what you’re looking for, there’s an entire section in the documentation about how to build a custom UI, and even how to write tests for the display logic.
After you have finished with this part, you should be able to open Flipper and see your plugin listed in the “Unavailable Plugins” display of the Flipper desktop app. Our plugin is considered “Unavailable” because no currently running application is available to connect to it…yet.
Build and launch your Android app and the plugin should now become “Disabled”.
We can now click “+” on the plugin row to “enable” it and start sending those analytics events – They should start showing up in the Flipper UI immediately!
Depending on your use-case, your events might not just be a simple string and timestamp. You’ll likely have defined some attributes, maybe the ID of an item being viewed, or the level number completed in a game. It would be great if there was a simple way to see all the data that corresponds to an event, right? Conveniently, the Flipper sidebar to show us that information in an easy to read way. All you need to do is click on the row, and a side panel will appear that renders our event as as JSON tree (I added some additional fields as a demo here):
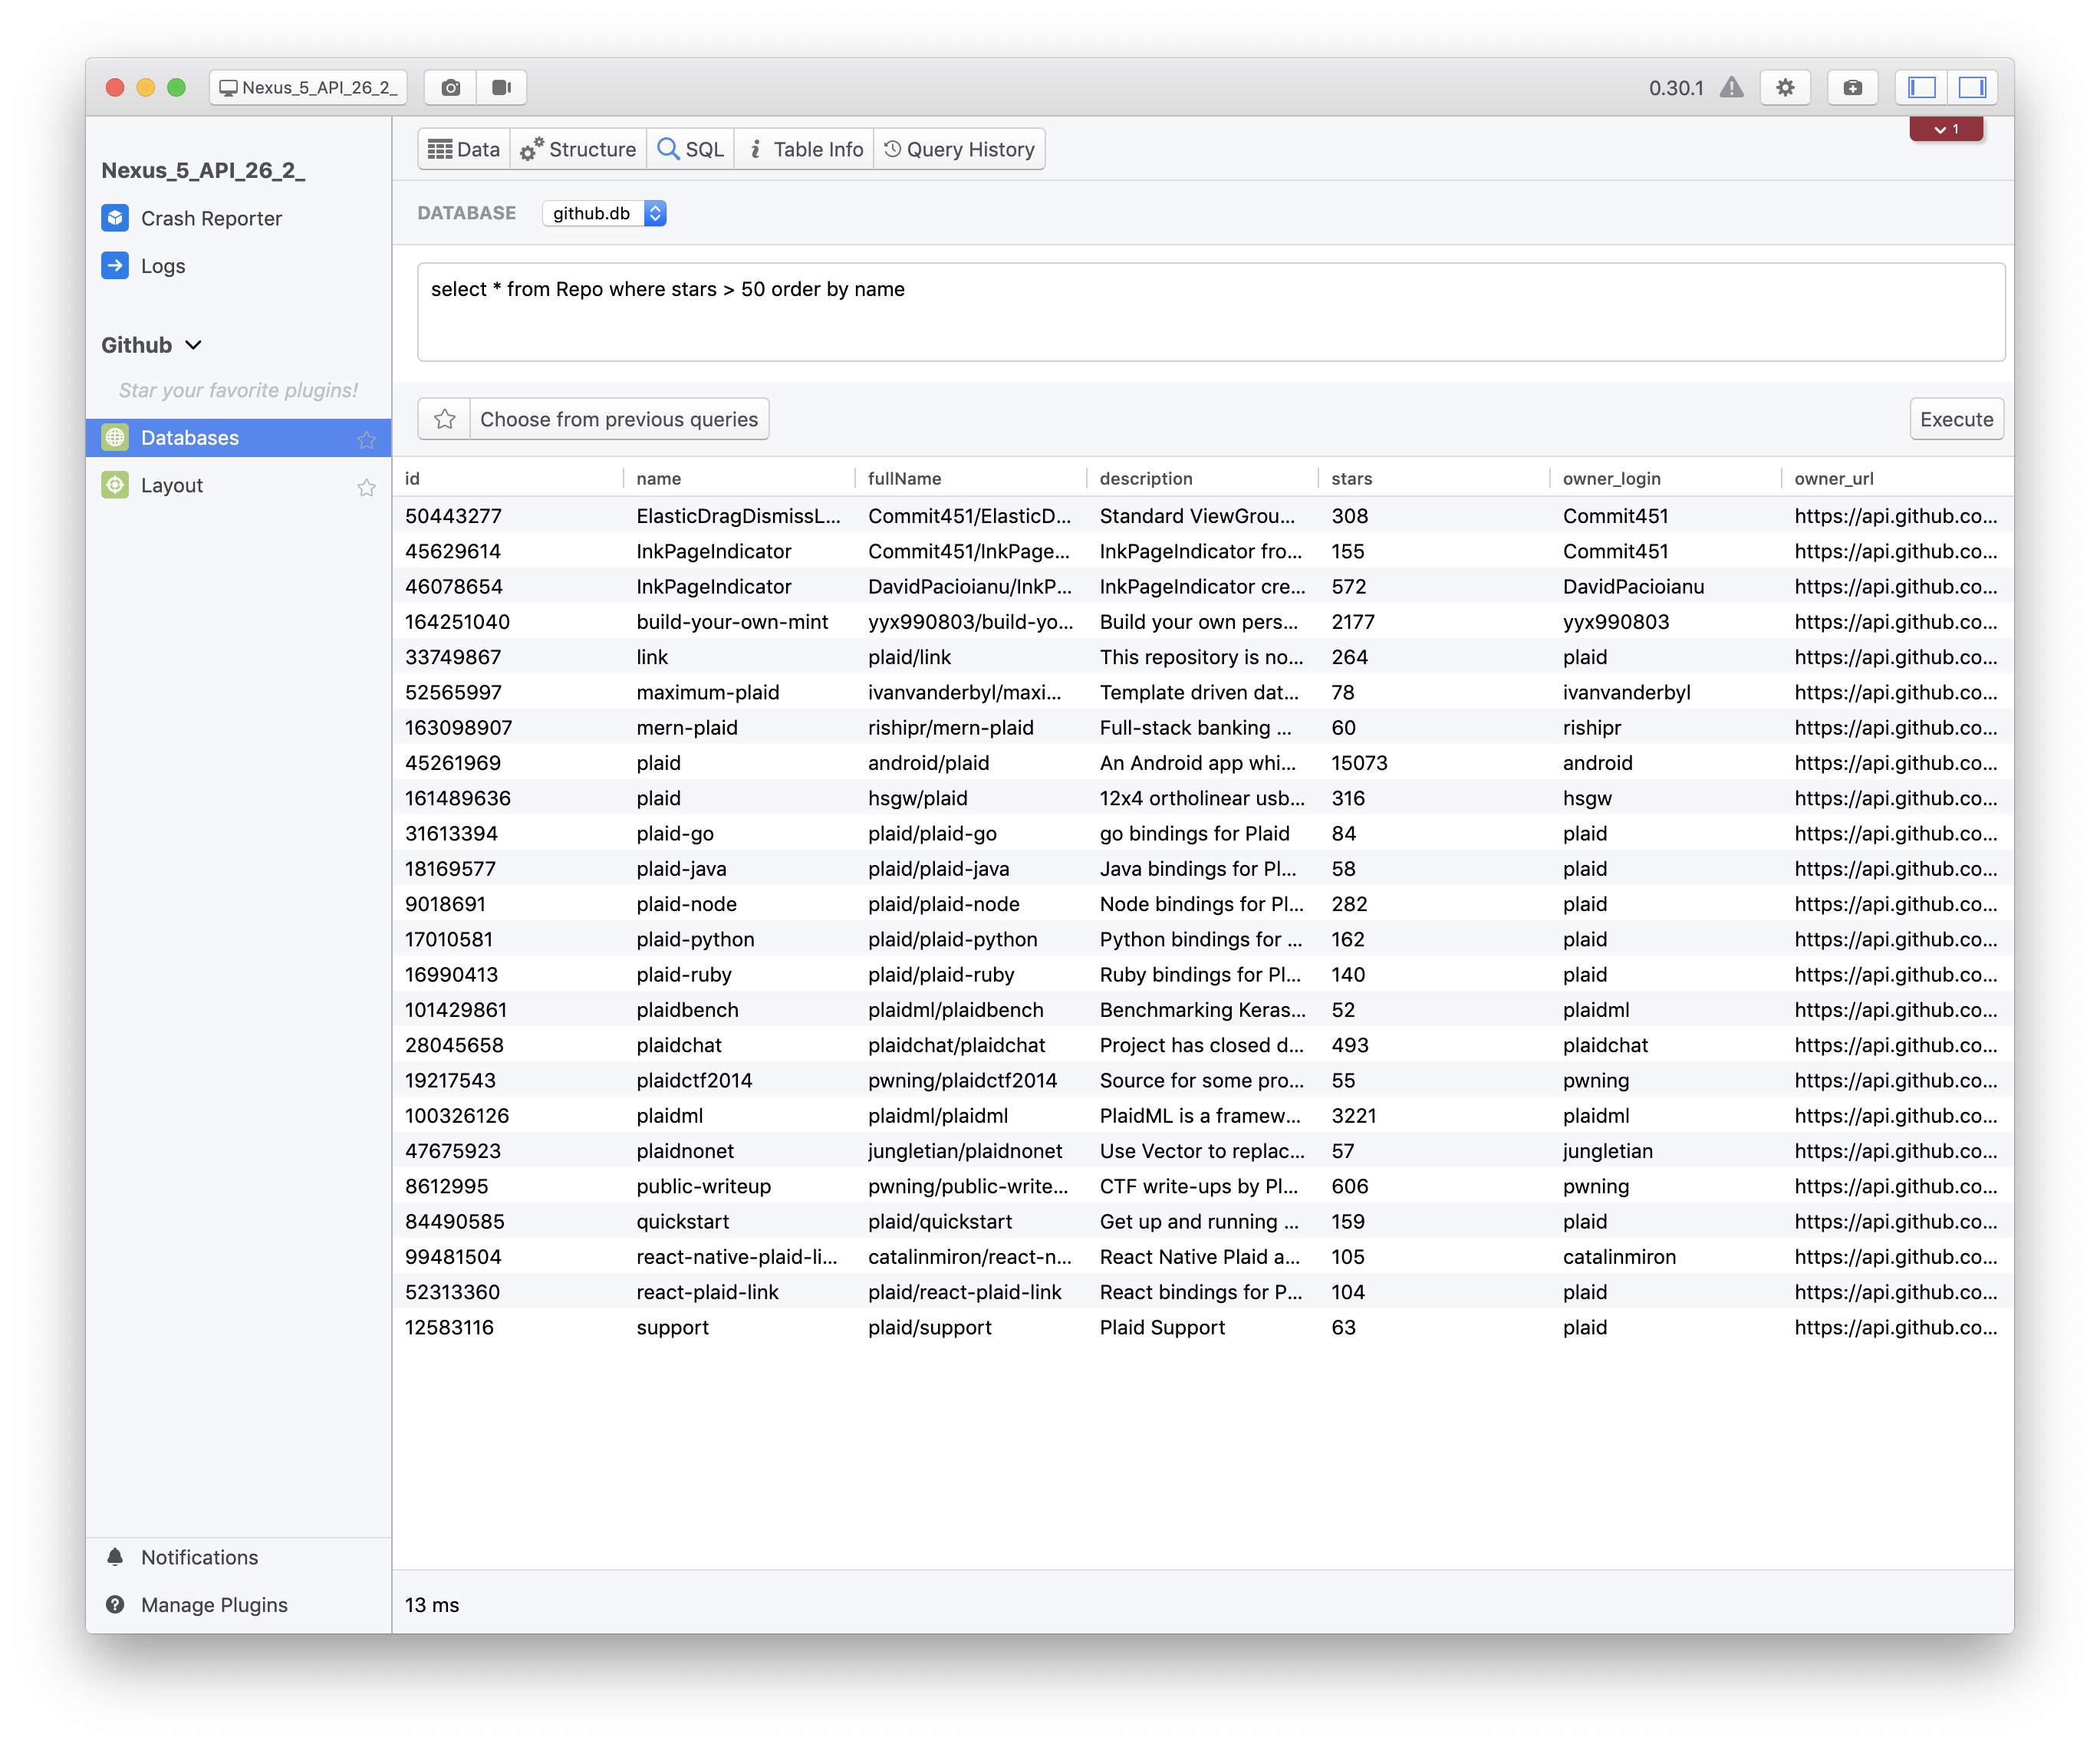
By using the table plugin on the desktop side, searching and filtering behavior all comes for free, which is amazing if your app sends a lot of analytics events!
The code for both the Desktop Plugin and the Android sample app can be found on Github here.
As this post demonstrates – the Flipper SDK is pretty flexible and allows you to build all sorts of custom development tools to help ease everday tasks. Come up with an idea for a cool plugin? Send me a tweet, I’d love to hear about it!
(Thanks to Zarah for the editing and feedback for this post!)
]]>I was lucky to get access to a cool trial box that Google sent out, complete with little goodies to try out some of the apps from the winners! Here are some obligatory unboxing photos:
After checking out the cool loot, I downloaded the winning apps to check them out, and wanted to show off some of my favorites.
The first app I tried was Trashly. The goal of this app is to make recycling easier by providing up-to-date information about where and how to recycle your items. You can type in any item that you’re interested in recycling, but what’s cooler (and relevant to the challenge) is that you can use the camera to detect an object and find out 1) if the item is recyclable, and 2) where you can go to recycle it. I tried this with a can of soda, which was instantly recognized:
And was given a map of nearby places that I could take my can to recycle. Very cool and useful!
The next app that I tried was Leepi. It’s a fun, educational app to help users learn American Sign Language. I personally had never learned Sign Language, so this was a really cool way to start! It uses the camera and on-device machine learning to interpret the user’s hand positions to verify that they are doing the hand positions and gestures correctly.
The last app I wanted to talk about was called Path Finder. The gist of this app is to use the camera and machine learning to build a heatmap of obstacles that might be problematic for visually impaired people in public environments. I tried the app out on the streets of New York City and have some screenshots of the results below. I am not sure how useful this would be in practice, but it certainly looks interesting. I would be curious to hear feedback from someone who is visually impaired to hear their thoughts on the presentation format.
If you’re interested in seeing the very cool and interesting things you can do with on-device machine learning, I definitely encourage you to check out these and the rest of the winning apps. And if you’re an author of one of these applications, congratulations on a job well done!
]]>Like Stetho, Flipper has many built-in features – including a layout inspector, a database inspector and a network inspector. Unlike Stetho though, Flipper has a very extensible API which allows for tons of customization. Over the next few articles, we’re going to take a look at Flipper and its plugins, the APIs it provides, and how we can leverage them to help us debug various parts of our app. This post will focus on getting set up with Flipper, as well as taking a look at two of its most useful default plugins.
Getting started with Flipper is really easy:
1 2 3 4 5 6 7 8 9 10 |
|
1 2 3 4 5 6 7 8 9 10 11 12 |
|
And that’s it! Opening the desktop client should show you an overview of your app with the Inspector plugin configured.
The Inspector Plugin is similar to the one found in Android Studio 4.0, but has a few neat features. I like it because it operates in real-time, and doesn’t require any attaching to process in Studio every time you want to inspect a layout.
Another thing you can do in the Layout Inspector that’s really cool is actually edit properties! Pretty mind blowing to make tweaks in the inspector and watch the views change in realtime. It’s really handy for experimenting with changing padding, and text colors. It doesn’t actually edit any of your xml files, but this allows you to iterate quickly to make sure everything looks right.
Let’s find a view we want to update (like our repository name):
We can click on the the color swatch to open a color picker:
And now when we look over at our device:
Neat!
Something I’ve wanted for a long time was a way to view the contents of my database from Android Studio. Right now, if you want to visualize your data or try out some queries – the best solution is to pull the sqlite database file off your emulator/device and run sqlite locally. But with Flipper, there’s a better way!
All we need to do is configure the database plugin, and our tables should show up right away:
1
|
|
Now we can easily inspect the contents of our tables, and even run queries on the live running application!
I’ve pushed a branch of the Github Browser Architecture Component sample with these changes to GitHub if you’d like to try it out. Next time we’ll take advantage of Flipper’s extensibility to create our own plugins to make debugging our app easier!
]]>Dropping tables that are no longer used is pretty easy (especially if you can just use something like Room’s Migrations) but when trying to remove unused columns, I ran into an unexpected problem. I thought to myself, it’s pretty easy to add or rename a column, why would dropping one be any harder? The existing database library I was using already had a convenient “drop column” method, so I simply called that and tried to run the migration. During the process, I ended up with a ForeignKeyConstraintException
! I quickly scanned the schema to see what could have caused that, and didn’t see anything obvious. The table I was trying to modify didn’t have any foreign keys itself, and the column I was dropping was not a foreign key. Curious to understand what was happening, I started to dig into what this method call was doing.
I saw that although you can add a column with SQLite’s ALTER TABLE ${tableName} ADD COLUMN ${columnName} ${columnType}
statements, there’s no support for removing a column out of the box. The library method I was using emulates dropping a column by doing the following:
$tablename_old
$tablename_old
to $tablename
$tablename_old
, since we don’t need it anymore.This process seems to make a lot of sense – since we can’t remove the column on its own, let’s just make a new table with the structure we want and copy over the data that we want to keep. So why does this process not work?
If you read the SQlite documentation linked above closely, you might have noticed an important note:
Compatibility Note: The behavior of ALTER TABLE when renaming a table was enhanced in versions 3.25.0 (2018-09-15) and 3.26.0 (2018-12-01) in order to carry the rename operation forward into triggers and views that reference the renamed table. This is considered an improvement. Applications that depend on the older (and arguably buggy) behavior can use the PRAGMA legacy_alter_table=ON statement or the SQLITE_DBCONFIG_LEGACY_ALTER_TABLE configuration parameter on sqlite3_db_config() interface to make ALTER TABLE RENAME behave as it did prior to version 3.25.0.
What this means is that when we use ALTER
to rename a table, any triggers/views/foreign keys that reference that table will now be updated to support it. As an example:
Let’s say we had a table users
with a few columns: id
, first_name
, last_name
, and age
, and we had a table orders
with the columns id
, order_number
and user_id
, where user_id
was a foreign key back to the users
table. It might look a little like this:
Following the steps above, let’s try to drop the age
column. First we’ll rename the existing table into users_old
, and create the new table:
Then we copy the the data, and try to drop users_old
, and this is where we run into the exception. The grey line in the diagram is our foreign key association, and that will no longer be valid because the orders
table will be trying to reference users_old
which we are trying to drop.
Fortunately the documentation lists out a better sequence of steps to perform this operation:
Looking at it more visually – we’ll start with the same tables and create a new table named users_new
to hold the preserved data:
Then we’ll do the data copy, drop, the old table (but the foreign key relation will still reference the users
table), and rename users_new
to users
.
These steps will ensure that no existing links (views, triggers, etc) are modified. That way when we rename the table in the final step, the existing links will end up referencing the new table already.
TLDR:
1 2 3 4 5 6 7 8 9 10 |
|
Hopefully this discovery helps you better clean up those unused columns in your databases!
]]>- improved build performance
- enables on-demand delivery
- pushes you to build reusable, discrete components
Sounds great, right? Are there any downsides? There is one in particular which has been a a pain point for many.
Often times when you’re writing tests, you’ll want to use some test doubles like fakes or fixtures in order to help simulate the system under test. Maybe you have a FakeUser
instance that you use in your tests to avoid having to mock a User
every time your test calls for one. Generally these classes live alongside tests in src/test
directories and are used to test out your code within a module.
For example, maybe you have a model object like:
1 2 3 4 5 6 7 8 9 10 11 12 13 14 15 16 17 |
|
You might have some code in src/test
that creates a bunch of fake users for your tests like:
1 2 3 4 5 |
|
This works great if you’re testing code within a module, but as soon as you’d like to use these fake users in other modules, you’ll note that these classes aren’t shared!
This code can’t be shared between modules because Gradle doesn’t expose the output of your test source set as a build artifact. There are all kinds of solutions for this problem out there, including creating a special module for all your fixtures, and using gradle dependency hacks to wire up source sets.
However, that’s not necessary anymore! As of version 5.6, Gradle now ships a new ‘test-fixtures’ plugin! This plugin creates a new testFixtures
source set, and configures that source set so that:
- classes in this set can see the main source set classes
- test sources can see the test fixtures classes
You can apply the java-test-fixtures
plugin in your build.gradle script:
1 2 3 |
|
This plugin will define the necessary source set, and handle all the wiring up of test artifacts. We can now move those test fixtures from src/test/java
to src/testFixtures/java
, and that’s it! These classes will be ready to be consumed by other modules.
Finally, we need to use a special keyword to pull these new fixtures in as a dependency for our tests. In our gradle configuration, we add a test dependency (either API or Implementation) like so:
1 2 3 |
|
And that’s it! Our other module can now consume these test fixtures without any sort of intermediate modules or workarounds.
If you’d like to check out the complete configuration with examples sharing fixtures between both Kotlin and Java modules to a shared “app” module, I’ve uploaded a sample project demonstrating how to use this new configuration here.
It’s important to note that this feature is currently only available with the java-library
plugin, and has limited functionality in Kotlin modules, and not yet available for Android modules. There are currently feature requests on YouTrack and the Android Issue Tracker to take advantage of this new functionality.
Since then, I think it’s safe to say that most developers have needed to make a ViewPager. Despite how prolific it is, it certainly isn’t the most straightforward widget to include. I think we all have at least once wondered whether we should use a FragmentPagerAdapter
or a FragmentStatePagerAdapter
. Or wondered if we can use a ViewPager without Fragments.
And API confusion aside, we’ve still had long standing, feature requests. RTL support? Vertical orientation? There are numerous open source solutions for these, but nothing official from the support library (now AndroidX)…until now!
Let’s dive in and try to set up ViewPager2! You’ll need your project configured with AndroidX already, as well as supporting minSdkVersion 14 or higher.
The first thing we’ll need to do is add the library to our build.gradle dependencies.
1
|
|
If you’re familiar with RecyclerView, setting up ViewPager2 will be very familiar. We start off by creating an adapter:
1 2 3 4 5 6 7 8 9 10 11 |
|
and pair it with a RecyclerView.ViewHolder.
1 2 3 4 |
|
Finally, just like RecyclerView, we set the adapter of our ViewPager2 to be an instance of the RecyclerView adapter. However, you’ll note that there’s no need for a LayoutManager.
1
|
|
And with that, we have a working ViewPager2!
We can even set the orientation to scroll vertically with just one line:
1
|
|
Based on the release notes there are a lot of issues left to fix before this moves to a final release – but this is a long awaited update for one of those oldest support library components.
The sample code for this post can be found here. Thanks to Chris Banes’ CheeseSquare for the sample data for this demo!
]]>When the source code for Nougat was released this morning, my friend Vishnu found this interesting snippet in the SystemUI source (better known to end users as the System UI Tuner):
1 2 3 4 5 |
|
Long story short, if you pass the right extras to this activity, and you’ll get access to the Night Mode settings (as well as the infamous Quick Tile!).
Fortunately for us, this is pretty trivial to accomplish with adb
via adb -d shell am start --ez show_night_mode true com.android.systemui/.tuner.TunerActivity
, but not everyone who wants this feature is familiar with adb
. So I published an app to the Play Store that does exactly that – click one button, and get access to those settings! You can find the app on the Play Store here.
This is all well and good—unless you’re like me (and countless others) and want to use a different configuration for your debug and release builds. This would be useful, as an example, if you use Google Play Services for GCM and would like to have development builds recieve pushes from non-production systems.
It seems that the plugin is configured in such a way that it supports build flavors, but it does not yet support build types. However, with a little Gradle magic, we can hack that support in.
Disclaimer: This approach worked for me—but as with any hack, it is subject to break.
So how can we go about doing this? We want to put the debug JSON file into the root of our app module during debug builds and use the release one for release builds. If you don’t do that, or if you attempt to put it in app/debug
and app/release
, you’ll get an error that says File google-services.json is missing from module root folder. The Google Services Plugin cannot function without it
.
This error is thrown by a task named process{VariantName}GoogleServices
. What we could do to solve this is swap the file in before that task is run! Using a little Groovy magic, I came up with this:
1 2 3 4 5 6 7 8 9 10 |
|
For each one of your variants, this code will create a new task – hackGps{VariantName}
, which copies a google-services.json
file from a config
directory into the root of your app module. Then it finds the corresponding Google Services task, and hooks itself in to run right before that! Now when you assemble your application, the right google-services.json
file will be in the right place, ready to be picked up by the plugin.
You might also want to .gitignore the app/google-services.json
file, so that you don’t keep committing the changed file to git
Hopefully Google will fix this issue in an upcoming release of the Google Services plugin, but until then – this technique should work!
]]>There are no API changes in RecyclerView nor my personal favorite support library – Support Annotations.
]]>Personally, I’m still a fan of Dagger 1 (or as I refer to it, Dagger Classic), and when I started working on my Kotlin app, that’s what I was planning to use. I knew Annotation Processing support was a relatively new addition to Kotlin, so I began to search for some information about how to get Dagger to play nicely with the Kotlin compiler. There’s a lot of information about using Dagger 2 with Kotlin but not so much about Dagger Classic. Finally, I stumbled upon this article, which said, “Unfortunately, Square’s Dagger 1 does not appear to work with Kotlin while Google’s Dagger 2 does”.
Bummer.
This didn’t really deter me, however, because I’m stubborn like that. So I proceeded to give it a try with kapt
1 anyway (which seemed like it might do what I want).
The first thing I did was try to create the various Dagger Modules that I’d need, which is where I hit my first roadblock. Attempting to compile my module gave the following error:
1
|
|
My intial thought was that Kotlin was causing my Module to extend Any
, rather than Object
. (Any is the root of the class hierarchy in Kotlin, similar to the way that Object is the root of the Java class hierarchy.) Upon closer inspection, that didn’t seem to be the issue, but rather than get hung up on this – I just converted my modules to Java classes and decided to come back to this issue later.
So now I had my modules set up, and I went about trying to @Inject
some fields on an Activity or two. This yielded another problem: Kotlin doesn’t have fields, and we obviously can’t do constructor injection on something for which we don’t control the constructor – like Activity
.
I thought I’d use Dagger to inject a property with “method” injection like so:
lateinit var service : MyService @Inject set
But when you try this – you’ll find out that Dagger doesn’t support Method injection!
So what can we do? We can target the annotation on the backing field like this:
1 2 |
|
And now when we compile, our dependencies are injected! Woo, progress.
I was pretty pleased that I had Dagger and Kotlin playing nicely enough that I could write things (other than my modules) in Kotlin, and that DI was working. But it did bother me that I was so close to having the ability to use Kotlin for everything with one exception – why wouldn’t these Modules play nicely?
I dug into the Dagger source to find out where this error was coming from and found this. The JavaDoc for TypeMirror’s equals method says, Semantic comparisons of type equality should instead use Types.isSameType(TypeMirror, TypeMirror). The results of t1.equals(t2) and Types.isSameType(t1, t2) may differ.
I was pretty proud of myself for finding this potential issue in Dagger, and was about to submit a Pull Request until I noticed…that Jake had solved this issue about 18 months ago.
Running the 1.3-SNAPSHOT
builds of Dagger that include this change allow my Modules to be compiled properly from Kotlin. Success!
kapt
instead of apt
for the scope of your dagger-compiler
dependencybuild.gradle
1 2 3 |
|
Hopefully this helps others who are still using Dagger Classic and want to try out Kotlin!
]]>Ever needed to type a JSON String? Perhaps you’ve used one as a text fixture for one of your GSON deserializers and know that it’s a huge pain to manage all those backslashes. Fortunately, IntelliJ has a feature called Language Injection, which allows you to edit the JSON fragment in its own editor, and then IntelliJ will properly inject that fragment into your code as an escaped String.
Inject Language/Reference is an intention action1, so you can start it by using ⌥+Return, or ⌘+⇧+A and searching for it.
This is pretty similar to the last tip, but if you select the language of the fragment as “RegExp”, you’ll get a handy regular expression tester!
Now I’m pretty sure most of you have used IntelliJ’s code completion features. Press ⌥+Space, and IntelliJ/Android Studio lists options to complete the names of classes, methods, fields, and keywords within the visibility scope. But have you ever noticed that the suggestions seem to be based off the characters you’ve typed, rather than the actual types that are expected in the scope of the caret? Something like this:
Well if you use Type Completion (by pressing ⌥+⇧+Space), you will see a list of suggestions containing only those types that are applicable to the current context. In the example below, you’ll only get types that return a Reader
, which is the type that the BufferedReader
’s constructor expects:
What’s even cooler is that you can press it an additional time, and IntelliJ will do a deeper scan (looking at static method calls, chained expressions, etc.) to find more options for you:
Another really cool feature is the Productivity Guide. It shows you usage statistics for a lot of IntelliJ’s features, such as how many keystokes you have saved or possible bugs you’ve avoided by using the various shortcuts. It’s also very helpful for discovering features you might not have known about; you can scroll through the list of unused features to see what you’re missing out on! To find the productivity guide, go to Help -> Productivity Guide
.
Did you know IntelliJ has its own REST client? Super handy for testing out API calls without something like Paw or Postman.
Have any other favorite tips or tricks? Let me know!
Intention Actions are those suggestions in the little popup menus that allow you to quick-fix things like classes that haven’t been imported, etc.↩
Setting up Espresso-Intents is dead simple if you’re already using Espresso. Make sure you’re already depending on Espresso, the rules, and the runner and then add the dependency:
1
|
|
Let’s imagine that you had an application with a button to launch the contact picker, which would then show the contact Uri
of the selected contact in a text view. Not only would this be hard to test because you are leaving your own application’s process, but you don’t even know if your test can rely on any contacts even existing on the test device (not to mention not knowing which app is registered to handle the contact-picking Intent itself). Fortunately we can use Espresso-Intents to stub out the response for activities that are launched with startActivityForResult
.
Here’s what that might look like:
1 2 3 4 5 6 7 8 9 10 11 12 13 14 15 16 17 18 19 20 21 |
|
Using the intending
API, we can respond with our mock ActivityResult
data. If you’ve used Mockito before, this stubbing will look very familiar to the when
/respondWith
methods. In this example, we’re going to stub any Intents for the ACTION_PICK
Intent with the CONTENT_URI
data set to return a particular hard-coded Uri.
So this is great — our test no longer depends on any particular contact picker app, or any contacts even being present on the test device. But what do we do if we want to verify that a particular outgoing intent is launched with some given extras or data?
Let’s say our sample app had an input field that would take a phone number, with a button to start the dialer to call that number. (Yes, I do realize that this application would likely not receive any venture capital funding).
All we have to do is use the intended
API, which is most similar to Mockito’s verify
method. A sample of this might look like the following:
1 2 3 4 5 6 |
|
In this case, we’re just going to verify that the intended Intent had the right action and the right data that we’d expect to hand off to the dialer.
And you’ll notice that the Espresso-Intents package includes handy Hamcrest matchers that you can use for things like Strings on the different parts of the Intent.
Now go forth and test those inter-app component interactions!
The sample code for this blog post can be found here.
]]>Espresso tests are dead simple to write. They come in three parts.
For example, the following test would type the name “Steve” into an EditText with the id name_field
, click a Button with the id greet_button
and then verify that the text “Hello Steve!” appears on the screen:
1 2 3 4 5 6 |
|
Seems simple enough right? But what about when other threads are involved?
From the Espresso documentation:
The centerpiece of Espresso is its ability to seamlessly synchronize all test operations with the application under test. By default, Espresso waits for UI events in the current message queue to process and default AsyncTasks* to complete before it moves on to the next test operation. This should address the majority of application/test synchronization in your application.”
But if you’re like me, you’re not writing AsyncTasks to handle your background operations. My go-to tool for making HTTP requests (probably one of the most common uses of AsyncTask) is Retrofit. So what can we do? Espresso has an API called registerIdlingResource
, which allows you to synchronize your custom logic with Espresso.
With this knowledge, one way you might approach this is to implement a mock version of your Retrofit interface, and then use something like this:
1 2 3 4 5 6 7 8 9 10 11 12 13 14 15 16 17 18 19 20 21 22 23 24 25 26 27 28 29 30 31 32 33 34 35 36 37 38 39 40 41 42 43 44 45 46 47 48 |
|
This tells Espresso that your app is idle after the methods are called. But you should immediately see the problem here – you’ll end up writing a TON of boilerplate. As you have more methods in your interface, and lot of repeated increment and decrement code…there must be a better way. (There is!)
The “trick” lies right in the selling point in the Espresso documentation, “Espresso waits for UI events… and default AsyncTasks to complete”. If we could somehow execute our Retrofit requests on the AsyncTasks’ ThreadPoolExecutor, we’d get sychronization for free!
Fortunately, Retrofit’s RestAdapter.Builder
class has just such a method!
1 2 3 |
|
And it’s that simple – Now you have no excuse not to write some Espresso tests!
Thanks to Huyen Tue Dao for editing this post!
]]>@NonNull
and @Nullable
are probably the most basic of the support annotations, but also some of the most helpful! Annotate a parameter or method with either of these to denote if the parameter or method’s return value can be null or not, and voila, now Android Studio can give us a nice warning that we’re doing something unsafe.
Turn this:
into this:
Bonus points: We can even take this example one step further with the @CheckResult
annotation, to tell us know that the return type of this method is something that we are expected to use, rather than the method having a side effect.
Have you ever attempted to call setText
on a TextView, and gotten a somewhat mysterious android.content.res.Resources$NotFoundException: String resource ID #0x3039
exception? If you pass an integer to setText, TextView assumes it’s a String resource id, and will look it up in order to set the text. If only there were a way to denote that integers are not valid ids for this method…@StringRes
to the rescue!
1 2 3 |
|
Now if you try to pass a non-String resource id to this method, you get something like this:
(There are resouce annotations for all resoruce types, @DrawableRes
, @ColorRes
, @InterpolatorRes
, etc.)
Today I discovered a new support annotation @Keep
. According to the support annotation docs, this annotation hasn’t been hooked up to the Gradle plugin yet1, but it will let you annotate methods and classes that should be retained when minimizing the app.
If you’ve ever messed around with the cryptic -keep class com.foo.bar { public static <methods> }
incantations that you need to use to summon the Proguard Gods, you’ll know how painful it is to rip your hair out, while trying to exclude a particular method or class from being optimized away. This handy annotation will tell Proguard to leave the method or class alone – like so:
1 2 3 4 5 6 7 |
|
The best part is – if you’re using appcompat-v7
, you’re already including support-annotations
, so just start using them already!
Looks like this is merged into the 1.3 version of the plugin↩
1 2 3 4 5 6 7 8 9 |
|
It’s not quite as simple as setting the foreground to ?attr/selectableItemBackground
, or else you’ll see the ripple surpasses the corners (which doesn’t look so bad when your border radius is small, but this would look terrible with a circlular view):
The solution for this lies in the special mask layer of the RippleDrawable. You specify the mask layer via the android:id
value set to @android:id/mask
. For the example above, you can set the mask to the same size/shape as the view you’re masking, and then the ripple will only show for that area. For something like our example above, you’d use something like this:
1 2 3 4 5 6 7 8 9 10 11 |
|
Now when you tap on the view, you’ll see something like this:
Huzzah!
Another tip: if you don’t set a click listener for a FrameLayout (like we used in this example), the pressed state will never be used!
]]>One of these apps was Etsy, which had a very cool fading blur background effect, which you can see here:
As a learning experiment, I set off to replicate this behavior. I had seen a library by Manuel Peinado called GlassActionBar which demonstrated a similar glass-like blur effect on the ActionBar, so I decided to use that code for blurring my background.
The code itself is pretty interesting, specifically the bit for versions on Jelly Bean or higher. If you’re using API version 16 and up, you can use Renderscript Intrinsics, which are a set of built-in functions that require very little code to use, but are optimized for high-performance.
In my sample tests, using Renderscript to blur the image took on average about ~175ms, vs ~2 seconds doing the blur using Java code. (The required code is also only a tiny fraction of the length of the Renderscript one).
Renderscript is extremely easy to add to your project, just throw
1 2 |
|
in your build.gradle
and you should be ready to roll.
Once you have the blurring, the rest of the process is fairly straight forward. When you plan to leave an activity, create a bitmap of the current view and write it to disk. When you start your new activity (which should have a transparent background), you override the transition (otherwise you’ll get the default zoom), and set the background to the blurred image you saved earlier. Add a fade in for the alpha and you get a nice little effect!
If you’d like to see how this looks in a sample project, you can find it on Github here.
]]>Here’s how I did it:
1 2 3 4 5 6 7 |
|
This will leave you with a disk image named obs-studio-x64-<sha1-hash>.dmg
, which you can mount and install, just like any other OS X application.
Happy Streaming!
]]>Fortunately for me, Google allows you to embed posts into your pages using a technique which is documented here. The problem with this method, for me at least, is that my blog is created using Octopress, and posts are written in Markdown and then rendered to HTML. Octopress does, however, allow you to write plugins which can help us with this issue.
Here’s the plugin in all it’s glory:
It’s also ingeniusly simple. First, connect the device you want to use via a USB cable.
1 2 3 |
|
That’s it! Enjoy your tether-free development.
]]>